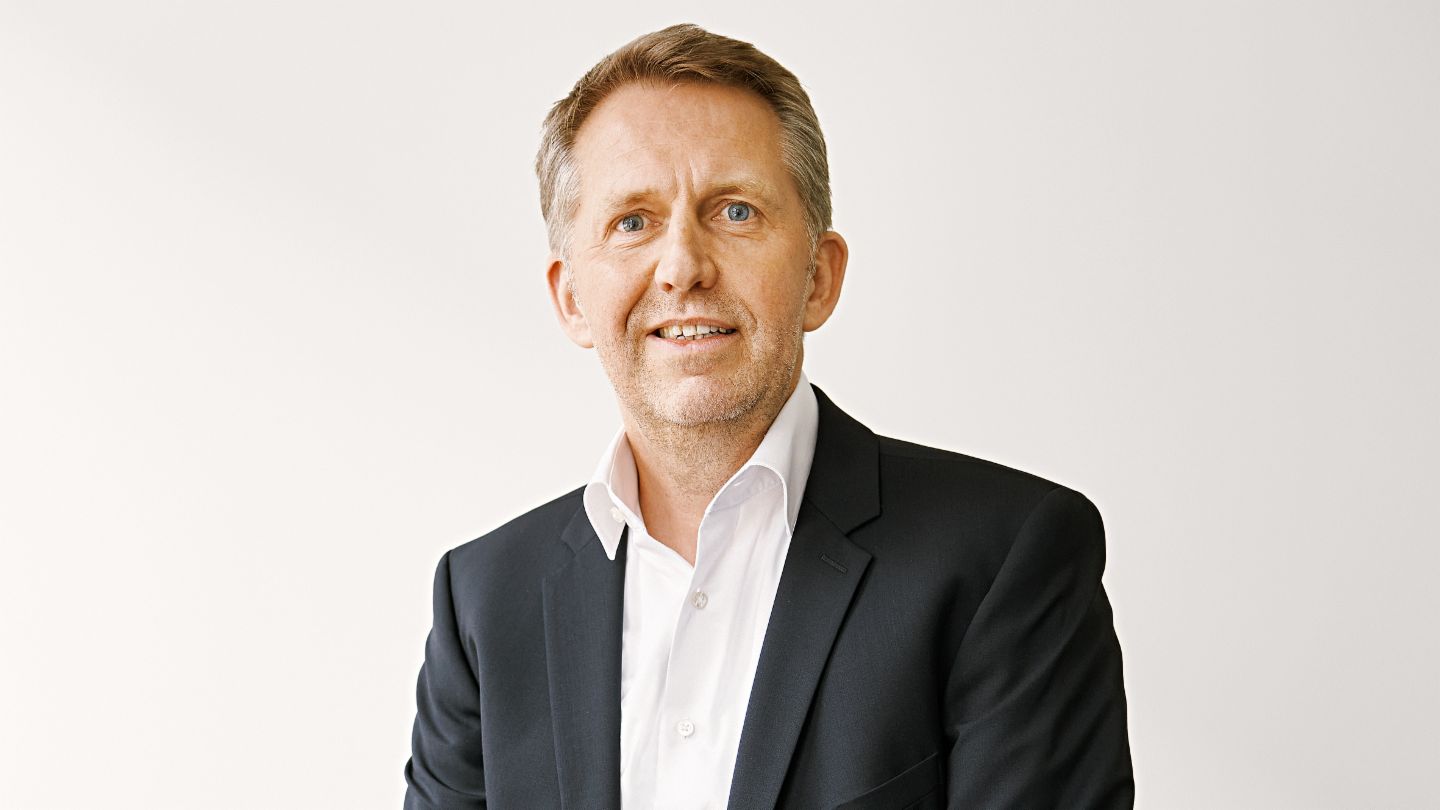
CEO of the EOS Group
Welcome to our
This is EOS
EOS – your expert in receivables management
The EOS Group is a leading international, technology-driven expert in receivables management with more than 6,000 employees in 24 countries. For more than 45 years we have helped companies with our operational expertise so they can focus on their core business. Our clients work in many different sectors, such as banking, energy utilities, real estate, mobility, insurance, telecommunications and e-commerce.
The fiscal 2021/22 in brief
Stable development in turbulent times
The EOS Group looks back on a solid fiscal year 2021/22. EOS wrapped up the business year with a slight revenue increase despite pandemic-related restrictions, planning uncertainty and a tense competitive environment.
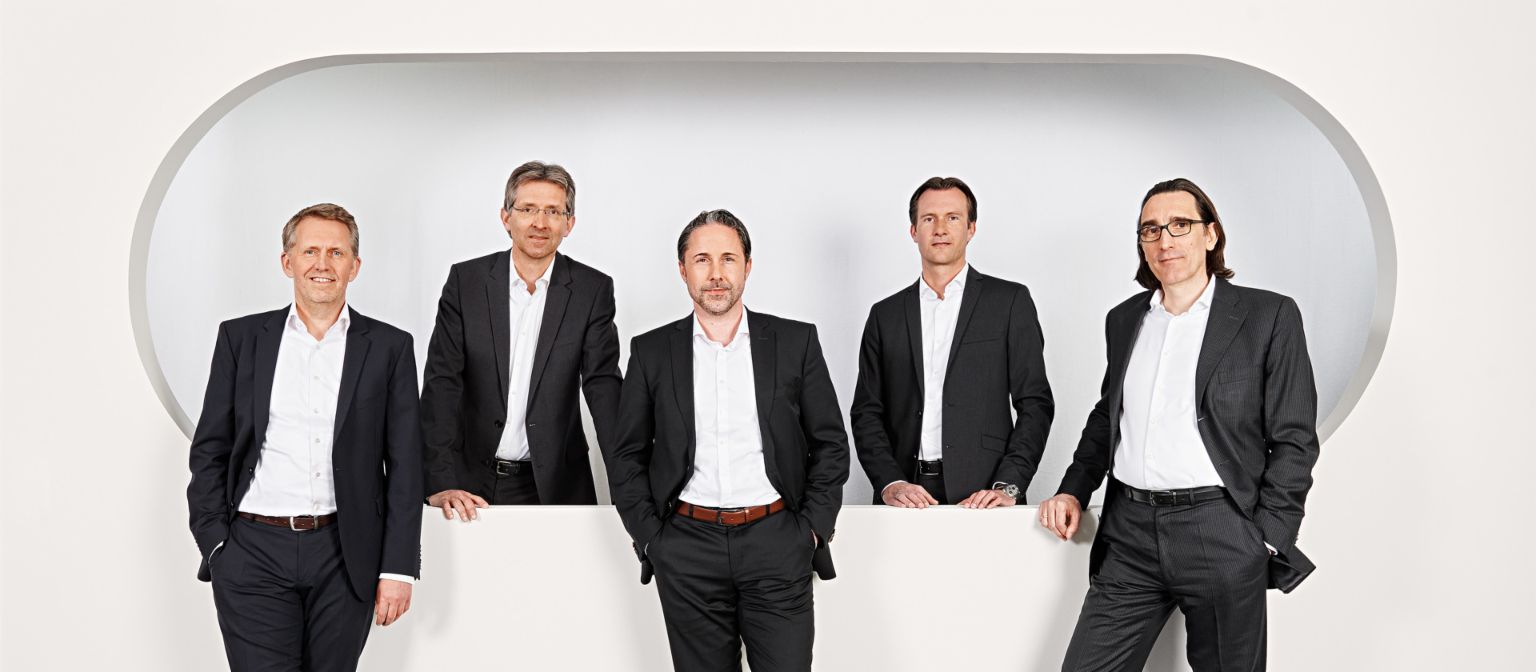
The five members of the Board of Directors draw a positive resume and look back on the highlights of the financial year:


The 2021/22 fiscal year

Insights into the financial year:
A comparison of revenue and earnings
After a slight decline in the previous year, EOS recorded a surge of 1.6 percent in total revenue in the 2021/22 fiscal year. The Group experienced growth especially in Eastern and Western Europe. For the first time, Germany was not the region with the highest revenue.
Consolidated revenue by region 2021/22
The share of consolidated revenue generated by Eastern and Western Europe continues to grow. Despite a slight five percent decline, Germany remains one of the strongest performing regions within the EOS Group. The decline in revenue is primarily a consequence of the fierce competition in the NPL market. The steepest decline was recorded for the North American market, which can be attributed to the divestment of the North American subsidiaries during the year.
Petra Scharner-Wolff: “EOS has established itself as a fixture of the Otto Group.”

Financial performance in 2021/22
Revenue by region
In the financial year 2021/22, consolidated revenue increased by 1.6 percent to EUR 804.9 million, which was slightly above prior year (EUR 792.5 million). With an increase of 12.2 percent, the companies in Eastern Europe recorded the steepest climb, followed by Western Europe with an increase of 9 percent.
Revenue in Germany declined slightly, but remained high at EUR 274.8 million. Results in North America reflect the divestment of the subsidiaries that took place during the year. Revenue in that market was significantly below the previous year’s level.
| | 2021/22 | 2020/21 | Change over prior year in % |
|---|---|---|---|
| Eastern Europe | 280,148 | 249,719 | +12.2 |
| Germany | 274,809 | 289,124 | –5.0 |
| Western Europe | 225,644 | 207,104 | +9.0 |
| North America | 24,276 | 46,575 | –47.9 |
| EOS Consolidated | 804,877 | 792,522 | +1.6 |
Income statement
In the fiscal year 2021/22 EOS Consolidated achieved EBITDA in the amount of EUR 282.5 million (previous year: EUR 312.4 million). Compared to prior year, revenue climbed by EUR 12.4 million as a result of economic recovery that followed the first year of the pandemic. Measured against revenue and disregarding precautionary accounting measures, other operating expenses increased proportionately by 9.4 percent, or EUR 23.3 million. Other operating income and in-house work (debt collection software) capitalized with an effect on income were at the same level as in the previous year.
| | 2021/22 | 2020/21 |
|---|---|---|
| Revenue | 804,877 | 792,522 |
| Total operating income | 815,215 | 804,003 |
| Earnings before Interest, Taxes, Depreciation, and Amortization (EBITDA) | 282,453 | 312,406 |
| Earnings Before Tax (EBT) | 228,544 | 253,805 |
| Net income | 201,236 | 223,822 |
Assets situation
Total assets of EOS Consolidated climbed by 4.7 percent to EUR 2.4 billion compared to the previous year. Among other factors, the increase can be attributed to the purchased portfolio of receivables and real estate*, which, due to the higher total investments in the financial year, climbed to EUR 2.0 billion. Purchased portfolios account for 75.4 percent and real estate in inventories for 7.8 percent of total assets.
*Financial presentation
| | 2/28/2022 | in % | 2/28/2021 | in % |
|---|---|---|---|---|
| Fixed assets | 209,498 | 8.8 | 234,620 | 10.3 |
| Purchased receivables and real estate in inventories* | 1,989,455 | 83.2 | 1,898,522 | 83.1 |
| Receivables | 29,949 | 1.3 | 60,964 | 2.7 |
| Cash and cash equivalents | 105,455 | 4.4 | 50,211 | 2.2 |
| Other assets | 56,457 | 2.4 | 39,161 | 1.7 |
| Total assets | 2,390,815 | 100 | 2,283,478 | 100 |
Equity and financing
In the past financial year, total financing increased by EUR 107.3 million to EUR 2.4 billion compared to previous year. The company’s equity increased to EUR 895.7 million, due in part to a partial profit retention from the previous year’s result. Thus, the equity-to-assets ratio increased further to 37.5 percent (previous year: 35.1 percent), which, relatively speaking, constitutes a very high level for a financial services provider. EOS Consolidated satisfies its refinancing needs with loans from banks and the parent company. The majority of this financing continues to have short-term maturity, which increased from 71 to 74 percent of debt financing compared to the previous year.
(For accounting reasons tables and text may contain rounding differences.)
| | 2/28/2022 | in % | 2/28/2021 | in % |
|---|---|---|---|---|
| Equity | 895,726 | 37.5 | 802,131 | 35.1 |
| Provisions | 84,218 | 3.5 | 100,355 | 4.4 |
| Liabilities with banks | 92,111 | 3.9 | 162,043 | 7.1 |
| Liabilities with related parties and companies | 1,102,833 | 46.1 | 1,010,266 | 44.2 |
| Trade payables | 41,962 | 1.8 | 42,147 | 1.8 |
| Other liabilities | 173,966 | 7.3 | 166,537 | 7.3 |
| Total financing | 2,390,815 | 100 | 2,283,478 | 100 |
In fiscal year 2021/22, EOS continued to support companies such as banks in reducing their non-performing loans (NPL) and receivables. Some highlights at a glance:
We continue to invest at a high level
After the pandemic subsided, EOS once again increased its investments in non-performing debts and real estate in the 2021/22 fiscal year. The increase of the total volume was in the three-digit million range. In particular, EOS boosted the purchase of secured receivables and real estate.
Investments in debt purchases and real estate in 2021/22
The EOS Group increased its investments significantly compared to previous year. Total volume rose by about 25 percent, from a total of EUR 534.3 million in the previous year to EUR 668.6 million. Investments were made in unsecured and secured debts and in real estate. EOS again purchased most NPL portfolios in the Eastern European market, followed by Western Europe and Germany. In addition, EOS purchased receivables portfolios in countries where the Group is not represented by its own company. EOS cooperates with local debt collection experts when making decisions about potential purchases of receivables portfolios, which the partner then handles locally in a professional manner. At EOS, these collaborations are called “Debt Collection 4.0.”
Unsecured in 2021/22
Secured / Real estate in 2021/22
Purchased receivables in 2021/22
At EUR 1.99 billion*, the carrying value of the portfolios recognized at the end of the financial year was just below the two billion mark. This constitutes an increase of almost five percent thanks to a total value of some EUR 100 million above previous year’s figure. It is a development which shows that debt purchases are still on a course of growth. At EUR 1.31 billion, unsecured receivables portfolios still totaled more than twice that amount for secured portfolios and buildings combined. Eastern Europe holds the most receivables in the entire Group, followed closely by Western Europe and Germany.
*Financial presentation
(For accounting reasons tables and text may contain rounding differences.)
Unsecured 2021/22
Secured / Real estate in 2021/22
All figures and charts for fiscal year 2021/22 are also available for download in PDF format.
Annual Report (1.7 MB)Our Focus Topics
Debt collection means assuming responsibility
EOS has defined sustainability goals in its Corporate Responsibility (CR) strategy. In its efforts to change finances for the better, the company is taking more responsibility in four areas of action.
The Corporate Responsibility highlights of the year in a video
Elk bedrijf in elke branche kan bijdragen tot meer duurzaamheid.

“Data have changed the face of our world”
Networked in 24 countries to form one Group
The EOS Group focuses on international networking. Our experts in 24 countries cooperate closely in order to change the finances of our clients and of consumers for the better. Their collaboration has made EOS an expert in cross-border debt collection. With our network of 83 partner companies, EOS processes cross-border debt collection cases in more than 180 countries. At the core is our IT platform EOS Global Connection, where partners and customers can follow the development of a case in real time.
As of July 2022


